Your website had 16,000 visitors last month. Great news, right? Not if you typically average 40,000 monthly visits.
Nor if they only visited on page on the site before bouncing, spent less than 20 seconds on the site, and didn’t interact with the site in any way.
Unless, of course, those numbers are all better than you typically see. (And yes, I know that it’s not possible to average less than one page per visit …)
This is why we encourage our clients to keep two important ideas in mind as they evaluate the effectiveness of their website and other digital marketing: moving pictures over snapshots and insights over information.
Tracking Progress Over Time is Everything
A celebrity’s social media presence is going to hit numbers on the first day that most businesses won’t see in a lifetime. There’s no reason to despair at that reality – chances are your cheekbones aren’t as nice as the celebrity’s, either. Such is life.
Far more important is understanding how your numbers change over time and, critically, what causes them to change.
Obviously, you’ll want to do as much as you can of whatever you’ve determined drives more traffic, attracts more followers, encourages more engagement, even if you can’t always precisely identify or control exactly what that is.
That concept is quite easy to understand, so I won’t belabor it. It’s our second concept that can trip marketers up more easily.
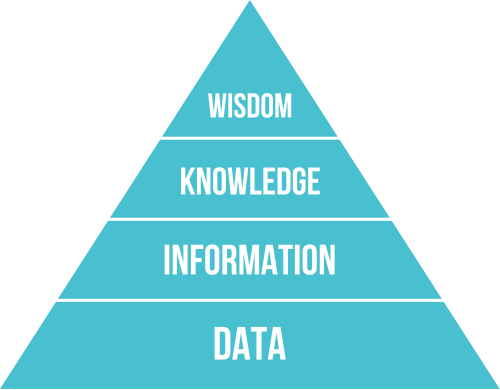
Insights Trump Information
Don’t get me wrong; we need the firehose of information to get the insights we want, but we shouldn’t mistake the information for insights.
That means not being satisfied with the raw data that comes out of, for example, your Google Analytics account. Instead, you should be working to combine it with other data – whether from within Analytics or elsewhere – that let’s you dig deeper. A few examples:
Tracking monthly traffic is a smart thing to do – you want to know whether your audience is growing. But looking for trends within each month can tell you whether your email marketing or a particular social channel is more effective at driving traffic to your site.
An even deeper look can tell you whether those channels are driving high- or low-quality traffic.
Finding your top performing content is important, as well. And again, a deeper dive than which page gets you the most traffic can be revealing. You may find, for example, that some piece of content that looks like a middle-of-the-pack performer is actually the star attraction for one particular service line or audience segment.
Of course if that service line or audience segment is a huge part of your audience, the content in question would also rise to the top of the analytics chart. But if it is the key producer for a smaller part of your business, you can use that knowledge to target your content to a more tightly defined segment of your audience.
Those kinds of insights are what make the difference between above-average results that improve over time and lackluster results that remain, well, lackluster.
Tracking results over time is easy. It just takes some discipline and a solid system. Turning data into insights is more difficult, but it too can be mastered with discipline and a system. A clear set of goals and some experienced guidance can help, as well. We’re here if you need us.
